
Safety Schools are Your College Emergency Plan
A safety school is like the emergency preparedness kit I bought at Costco -- I hope I never have to use it, but I keep it around just in case. (The freeze-dried food looks disgusting, probably because I have unpleasant memories of strawberry "astronaut ice cream" from elementary school.) Saying "I don't need a safety school because I'm sure my kid will get in somewhere else" is like saying, "I don't need emergency supplies because I'm sure a big earthquake will never hit California." More foolish than courageous.
Your child's college list needs at least a couple safety schools where admission is close to a sure bet. We don't have to love the safety school to appreciate its value in creating college choices.
In this post, I will first cover three common mistakes I see families make when picking safety schools. Then I will give you four clues you can follow to find safety schools.
Mistake #1: "UCLA and UC Berkeley are my child's safety schools."
Fact #1: UCLA and UC Berkeley are not safety schools for anyone.
Each year, I meet parents who tell me that UCLA and UC Berkeley are safety schools. No, they aren't. Neither are any other schools with acceptance rates below 25%. At best, these selective schools are medium-probability "target" schools. At worst, they are low-probability "reach" schools.
The UC admission process is not as simple as it was 30 or even 20 years ago. Back then, admissions decisions were based on an index calculated from a students SAT and GPA. If your index number was above the cut-off, you got in. It doesn't work that way anymore. The UC campuses use a process called "comprehensive review" to evaluate students' academic achievements based on fourteen criteria. They are looking beyond the numbers, and we should do the same. Gone are the days when we can say, "My kid's GPA and SAT are high, so I'm sure she'll get in." Keep UCLA and UC Berkeley on your child's list if she likes them, but don't call them safety schools.
MISTAKE #2: "I can tell if it's a safety school just by looking at the acceptance rate."
Fact #2: To find a safety school, you must consider not only the college's acceptance rate, but also how your child's ACT/SAT scores compare to a college's "mid-range" test scores.
I cannot tell you how many times I have had a parent tell me that a certain school is a safety school simply because its acceptance rate is high. But acceptance rate alone is not enough information to make that determination.
Let's do a quick case study. Consider Indiana University, which has an acceptance rate of about 75%. That sounds promising for a safety school, but it's not the whole story. To determine if Indiana is a safety school for a particular student, we must also compare that student's ACT or SAT score with the school's "mid-range" test scores. ("Mid-range" test scores are the range between the 25th percentile and the 75th percentile.)
Suppose a student applying to Indiana has a 24 on the ACT. Is Indiana is a safety school?
In an ideal world, we would ask Indiana, "What is the acceptance rate for students with a 24 on the ACT?" The problem is that colleges don't publish this information. What they do publish, however, are mid-range test scores. For Indiana, that range is 24-30. That means 25% of admitted students have an ACT lower than 24, and 25% have an ACT higher than 30.
You might wonder why I'm not mentioning GPA. The reason is that GPA calculations vary from college to college. So long as the GPA "matches" the ACT/SAT score -- for example, a student has a high ACT and high GPA -- we can use ACT/SAT score as a quick and easy way of approximating that student's academic achievement. When there is a mismatch -- high GPA and low ACT/SAT or low GPA and high ACT/SAT -- we need to be more conservative in our assumptions because we don't know how the college will treat this disparity. (If there is a mismatch, this is also great to address in the application's "additional information" section.) Another way to think of this is that GPA and ACT/SAT score often convey the same information, so we can get by looking only at ACT/SAT when we're figuring out whether a college is a safety school.
Knowing what we do about Indiana's acceptance rate, its mid-range scores, and our student's ACT score, what can we say about our student's chances? Indiana has an acceptance rate of about 75% and mid-range ACT scores of 24-30. Our student's 24 ACT score is right around the 25th percentile. So Indiana accepts 75% of applicants, but 75% of accepted students have higher ACT scores than our student. To me, these numbers suggest our student is right on the edge. Indiana is a toss-up, not a sure bet.
If we had considered only Indiana's 75% acceptance rate, we might have incorrectly concluded that Indiana is a safety school for our 24 ACT student. Multiply this mistaken logic, and you can see how easy it is to end up for families to misclassify medium-probability target schools as high-probability safety schools.
Mistake #3: "I've never looked at the Naviance scattergrams."
Fact #3: If your child's school uses Naviance, then the scattergrams are the best way to see acceptance trends for your child's high school.
"Have you looked at the Naviance scattergrams?" is a question I often ask parents. Occasionally, I still get "What are those?" as a response.
Not every school uses Naviance, but if your child's school does, you need to look at the scattergrams for the colleges your child is considering. Here is a sample scattergram:
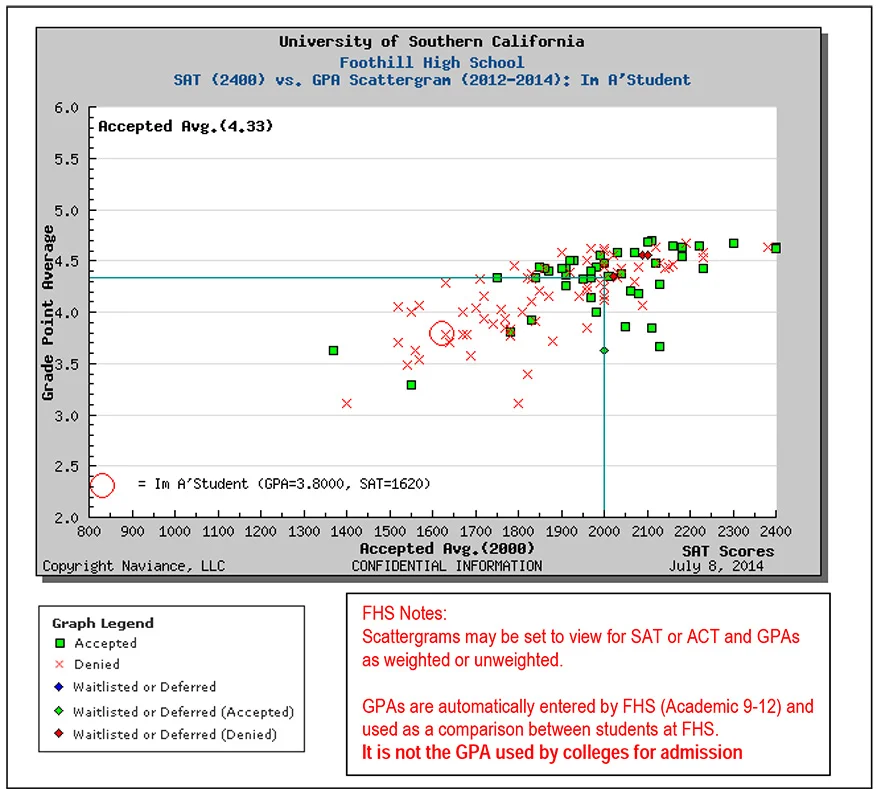
We see GPA on the y-axis and SAT scores on the x-axis. The red circle represents your child. The red "X" marks represent rejected applications, and the green squares represent accepted applications.
If your child's red circle is floating in a sea of green squares without many red "X" marks nearby, then the school is a safety school.
Summary: 4 safety school Clues
Let's make this practical. Here are four clues to indicate you might have found a safety school:
- The college's acceptance rate is at least 25%.
If the acceptance rate is less than 25%, it's not a safety school. And if your child is applying to an out-of-state public university, remember than acceptance rates for out-of-state students are often lower than for in-state students! For example, take a look at The University of Texas at Austin (29% out-of-state vs 45% in-state) or The University of North Carolina at Chapel Hill (15% out-of-state vs. 49% in-state). If the public university does not publish its in-state and out-of-state acceptance rates (and many don't), you can guess at the disadvantage for out-of-state students by looking at what percent of the student body is out-of-state students. The higher the proportion of out-of-state students, the less likely there is to be a disparity between out-of-state and in-state acceptance rates.
- Your child's ACT/SAT score is at or above the college's 75th percentile score.
For example, if Indiana's mid-range ACT score is 24-30 and your child has a 30, your child is right at the 75th percentile. That's a good indicator Indiana is a safety school.
- Your child's ACT/SAT score percentile for the school is higher than the college's "rejection rate."
By "rejection rate," I mean the percentage of applications the school rejects. This is 100% minus the acceptance rate. For example, Indiana accepts about 75% of its students, so its rejection rate would be 25%. Suppose your child has a 27 on the ACT; since Indiana's mid-range ACT score is 24-30, a 27 ACT score puts your child's score somewhere near the 50th percentile of ACT scores. Your child's ACT score is in the top 50% of the applicant pool, but Indiana's rejection rate is only 25%. Because the ACT score 50th percentile is so much higher than the 25% rejection rate, Indiana looks like a safety school.
- The Naviance scattergram shows many acceptances and few rejections for students with your child's GPA and ACT/SAT.
Naviance scattergrams are a great way to find safety schools because they provide school-specific data that is more detailed than the mid-range ACT/SAT scores the colleges publish. If the point on the scattergram representing your child is swimming in a sea of green squares, it's a safety school.
If you follow these four clues, you can avoid the miscalculations that lead to overly ambitious lists in the fall and fewer college choices in the spring. If things go well, your child won't end up attending her safety school, but we have to be prepared for the worst-case scenario.
Jon
P.S. If you found this post useful and would like to receive a brief monthly newsletter with links to all our latest blog posts, then feel free to sign up for our newsletter for parents.
P.P.S. You might be thinking, "I'm tired of googling the answers to my college questions. Isn't there a better way?" If that describes you, then we welcome you to join our private Facebook group for parents: Free College Counseling.